Abstract
The purpose of this study was to measure the tablet velocity in pan coating machines during the film coating process in order to understand the impact of the batch size (laboratory to commercial scale), coating machine type (DRIACOATER, HICOATER® and AQUA COATER®) and manufacturing conditions on tablet velocity. We used a high speed camera and particle image velocimetry to measure the tablet velocity in the coating pans. It was observed that increasing batch sizes resulted in increased tablet velocities under the same rotation number because of the differences in circumferential rotation speeds. We also observed the tendency that increase in the filling ratio of tablets resulted in an increased tablet velocity for all coating machines. Statistical analysis was used to make a tablet velocity predictive equation by employing the filling ratio and rotation speed as the parameters from these measured values. The correlation coefficients of predicted value and experimental value were more than 0.959 in each machine. Using the predictive equation to determine tablet velocities, the manufacturing conditions of previous products were reviewed, and it was found that the tablet velocities of commercial scales, in which tablet chipping and breakage problems had occurred, were higher than those of pilot scales or laboratory scales.
To protect public health, pharmaceutical companies are committed to ensuring the quality of pharmaceutical drug products which affect their effectiveness and safety (e.g., the content and purity of active ingredients, dissolution, and stability). In the Japanese pharmaceutical market, tablet appearance is an important product quality, in addition to the qualities mentioned above. This is due to a specific Japanese sense, where Japanese customers feel product quality is poor when they recognize a defect in tablet appearance. Therefore, many pharmaceutical companies introduce tablet inspection machines in their production line to inspect the appearance of tablets which are to be marketed in Japan. By conducting this inspection process, tablets with visual defects, e.g., chipped or broken, will be removed before packaging.
Generally, pharmaceutical drug products are manufactured by batch processes. Therefore, as one proceeds from laboratory to commercial scale manufacturing, scaling up of the manufacturing processes need to be considered. It is important to maintain the same drug product quality before and after the scale-up. However, because of the manufacturing scale effects, unexpected results which do not match those of the previous manufacturing scale are often obtained.
For the film coating process, pan coaters are mainly used as coating machines. As the coating pan rotates, the tablets inside are lifted up by the baffles and then slide down the surface of the tablet layers. As a result of their movement, tablet chipping or cracking may occur, and is a common problem associated with this part of the pan coating process. These problems often show up in commercial scale manufacturing using larger coating pans, while no problems may have occurred in the laboratory or pilot scale manufacturing using smaller coating pans.
When difficulty occurs during scale-up study, in most cases the formulation researcher has to put in long hours on experiments and use a considerable amount of raw material to find a solution for the problem. As the manufacturing scale increases, the time and money required for solving the scale-up problems also increase. Therefore, it is important to predict possible risks that can happen during the scale-up process. In order to predict these risks, scale-up rules based on empirical data are useful.
Regarding the scale-up study of the film coating process, there is a great amount of research focusing on the water content of tablets since the presence of water may affect the purity of the active ingredient. Other research has examined the thickness of the coating layer, which may affect the dissolution profile of the drug product.1–7) However, the number of reports focusing on tablet chipping or cracking during the coating process remains low.8–11) Mueller et al. developed a method for the prediction of tablet velocity using a round shaped pan coater coating from laboratory scale to 200 kg scale. They evaluated the influence of pan diameter and pan rotation speed.10) This method provides useful information concerning tablet velocity when using a round shaped pan coater. However, application of this method to polygon type pan coaters or pan coaters with different baffle types is difficult.
Understanding the degrees of stress/load imposed on the tablets at different manufacturing scales is of crucial importance to maintaining an equivalent quality of appearance before and after scale-up. A number of studies which utilized computer simulation technologies (e.g., discrete element method) as a means to understand such tablet behaviors during the coating process have been reported.12–14) Computer simulation technologies are very useful tools which enable the prediction of a tablet’s behavior even at manufacturing conditions which are difficult to execute in real experiments. On the other hand, in order to validate the outcomes from simulations, real experimental data is essential and the data amount affects the accuracy of a simulation model.
The purpose of this study is to quantify the tablet movements in a pan coater with the goal of understanding the differences arising from manufacturing scale variation. To do this, tablet motions were captured using a high-speed camera. The obtained images were analyzed by particle image velocimetry (PIV), an image analysis software, to quantify the tablet speed. Moreover, an equation was developed to predict the tablet speed in the pan coater using JMP, a statistical analysis software, from experimental tablet speed data obtained by the high speed camera and PIV. In this study, experimental data from various scales of machines, including laboratory and commercial, were analyzed to understand the load imposed on tablets at various manufacturing scales. This analysis was used to construct a predictive equation applicable to the scale-up process.
Experimental
TabletsOval (Tablet No. 1) and round (Tablet No. 2) shaped film coated tablets were used. The tablet shapes, sizes and weights are shown in Table 1.
Table 1. Tablet Shapes, Sizes and Weights Used
| Tablet No. | Shape and size | Tablet weight |
|---|
| 1 | Oval, 14.7×7 mm | 432 mg |
| 2 | Round, 8.5 mm diameter | 218 mg |
A DRIACOATER DRC-650, DRC-900, DRC-1400 and DRC-1600 (Powrex, Corporation, Japan), HICOATER® HC-170-FZ, HCD-17A and AQUA COATER® AQC-17AF (Freund Corporation, Japan) were used. These are widely used pan coaters classified as “pan coating” in the SUPAC-IR equipment classification.15) Scales of pan coaters in this study cover a range of laboratory and commercial scales, as shown in Table 2.
Table 2. Coater Types, Pan Shape, Pan Volume, Dimension and Scale of Coating Machine Used
| Type | Pan shape | Pan volume (L) | Dimension H×W×L (mm) | Scale |
|---|
| DRC-650 | Nonagon | 15 | 1850×1100×1500 | Laboratory |
| DRC-900 | Nonagon | 75 | 2300×1560×2000 | Pilot |
| DRC-1400 | Nonagon | 270 | 2800×1900×2750 | Pilot |
| DRC-1600 | Nonagon | 700 | 3450×2100×3500 | Commercial |
| HC-170-FZ | Round | 560 | 2700×2400×2400 | Commercial |
| HCD-17F | Octagon | 770 | 2800×2300×3220 | Commercial |
| AQC-17AF | Octagon | 780 | 3185×2400×3420 | Commercial |
Tablet motions were captured using a Himawari GV200 (Library, Japan) with the following specifications: monochrome 8 bit, resolution ratio 640×480, 1/3 inch type CCD, charge coupled device image sensor 7.4×7.4 µm, frame rate 400 fps at 640×480 resolution ratio, 2300 fps maximum, C mount.
Flow-vec (Library, Japan) PIV software, a type of flow vector analysis software, was used to analyze the images obtained by the high speed camera in order to quantify the tablet velocity.
Tablet Velocity MeasurementAt first, weighed film coated tablets were fed into the coating machine, and then the coating pan was rotated at a set rotation speed. After reaching the stable rotation speed, the motion of the tablets sliding down the surface of the tablet layers were captured by the high speed camera at 1000 fps. Using this image, the average velocity of the tablets during 2 s at the set rotating condition was quantified by PIV.
All experimental conditions are shown in Table 3. The filling ratio and the rotation speed were varied in the range of 25 to 100% and 2 to 20 rpm, respectively, to evaluate the influence of these parameters on tablet velocity.
Table 3. Experimental Conditions of Measuring Tablet Velocity
| Run No. | Tablet No. | Coater types | Maximum scales (kg) | Filling ratio (%) | Range of pan rotation (rpm) |
|---|
| 1 | 1 (Oval) | DRC-650 | 12 | 50–100 | 2, 4, 5, 8, 10, 12, 16, 20 |
| 2 | 1 (Oval) | DRC-900 | 12.5, 25, 37.5, 50 | 25–100 | 2, 4, 6, 8, 10, 12, 14, 16 |
| 3 | 1 (Oval) | DRC-1400 | 50, 100, 150, 200 | 25–100 | 2, 3, 4, 5, 6, 8, 10, 12, 14 |
| 4 | 1 (Oval) | DRC-1600 | 120, 240, 360, 480 | 40–100 | 2, 3, 4, 5, 6, 7, 8, 10 |
| 5 | 1 (Oval) | HC-170-FZ | 120, 240, 320 | 37.5–100 | 2, 3, 4, 5, 6, 7, 8, 9, 10 |
| 6 | 1 (Oval) | HCD-17A | 120, 240, 360, 480 | 25–100 | 2, 3, 4, 5, 6, 7, 8 |
| 7 | 1 (Oval) | AQC-17AF | 120, 240, 360, 480 | 25–100 | 2, 3, 4, 5, 6, 7, 8, 9, 10 |
| 8 | 2 (Round) | DRC-1400 | 100 | 50 | 2, 3, 4, 5, 6, 8, 10, 12, 14 |
| 9 | 2 (Round) | DRC-1400 | 150 | 75 | 2, 3, 4, 5, 6, 8, 10, 12, 14 |
The tablet velocity model was built with JMP statistical software version 6.0 (SAS Institute Inc., Cary, NC, U.S.A.). Experimental tablet velocity data were fit with a linear combination of rotation speed of pan coater and filling ratio of tablets variables to give the calculated formula by using multiple regression with standard least squares fitting and effect leverage emphasis.
Results and Discussion
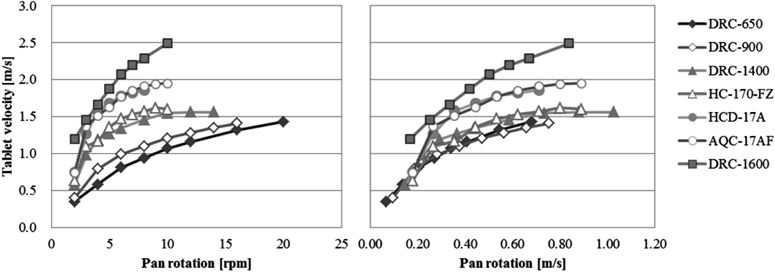
Tablet Velocity MeasurementThe tablet velocities at different manufacturing scales using Tablet No. 1 (from Run No. 1 to No. 7) under the 100% filling ratio are shown in Fig. 1. According to this result, higher tablet velocities are examined at larger manufacturing scales. Since the tablet speeds at the same pan rotation speed were significantly different between the laboratory (DRC-650) and the commercial (DRC-1600, AQC-17AF and HCD-17F) machines, the fact was revealed that it is extremely difficult to reach the same tablet velocity in both laboratory and commercial scales.
On the other hand, the tablet velocities of DRIACOATER (DRC-650, DRC-900, and DRC-1400) and HICOATER® (HC-170-FZ), which differ from DRIACOATER in pan shape, were equivalent when the circumferential rotation speed of each pan was set the same. The results of DRC-1600, HCD-17A, and AQC-17AF, which had the maximum filling weight of 480 kg, showed relatively high tablet velocity against the circumferential rotation speed of the pan. Among these 3 coating pans, tablet velocity in DRC-1600 showed the highest velocity of all machines. In terms of pan shape, HCD-17A and AQC-17AF have octagonal pans and DRC-1600 has a nonagonal pan. These results suggest that the manufacturing scales and the pan shapes may have an influence on the tablet velocities.
The tablet velocity is mainly determined by the potential energy of the tablet. The potential energy of the tablet changes in response to the tablet height. In terms of the manufacturing scale, the highest tablet velocity was observed in the commercial scale. This is in accordance with the fact that the maximum height which a tablet can reach during the rotation of a coating pan is the highest in the commercial scale.
Additionally, for the differences in tablet velocities observed between DRC-1600 and HCD-17A or AQC-17AF, it was assumed that the differences among the pan shapes and baffle shapes caused the differences in the maximum heights of the tablet layers in the coating pans.
Influence of Tablet Filling Ratio on the Tablet VelocityFigure 2 shows the influence of tablet filling ratio on the tablet velocity. The circumferential rotation speed of the pan was set at around 0.5 m/s for all pan coaters. For the HICOATER group, tablet velocity increased as the filling ratio increased. Observation of the tablets inside the coating pan revealed the fact that the maximum position of the tablets lifted up by the baffles became high as the filling ratio increased. This suggests that the average tablet velocity increased because of the increased potential energy of tablets under high filling ratio conditions.
The DRIACOATER group showed the same tendency as the HICOATER group. However, with the exception of DRC-650, the tablet velocities of DRC-900, DRC-1400, and DRC-1600 plateaued at a certain point. From the plateaued tablet velocity, it can be assumed that the tablet cascade formed by the rotating baffle starts to behave in a uniform way over a certain filling ratio. Therefore, when manufacturing, it may be appropriate to select a filling ratio higher than the point where the tablet velocity reaches its plateau (shown in Fig. 2). In addition, these results suggest that each coating machine has its own optimal operation filling ratio.
Influence of Tablet Shape on the Tablet VelocityWe investigated the influence of tablet shapes on tablet velocities using Tablet No. 1 and No. 2 (shown in Table 1) with two pan coaters of different scales. The pan rotating condition and tablet filling ratio was set the same for both tablet shapes (Run No. 8 and No. 9 in Table 3). The results are shown in Fig. 3. Although slight differences between Tablet No. 1 and No. 2 were observed at a slower rotation speed with the 75% filling ratio, the tablet velocities were approximately the same between Tablet No. 1 and No. 2 in both filling ratios.
Development of the Tablet Velocity Prediction from Statistical AnalysisFrom the experimental results shown in Figs. 1–3, the tablet velocity during the coating process changes with not only the rotation speed of a pan coater but also based upon the coating machine type, scale and filling ratio of tablets. The impact force on the tablets increased because the tablet velocity increased with the manufacturing scale. Therefore, the incidence of tablet chipping or breaking occurred only in commercial scale manufacturing because the mass of kinetic energy in the commercial scale may be high enough to break the tablets.
And also, in the case of different tablet filling ratio conditions, it was found that the impact force by kinetic energy on the tablets during a coating process will change even if they are manufactured under the same manufacturing conditions using the same coater type as prior manufactured drug products. If the tablet velocity of laboratory manufacturing and commercial manufacturing can be set the same, it becomes possible to avoid the difficulty of tablet breakage in commercial scale manufacturing.
Therefore, from the experimental results, and using statistical analysis made in JMP statistical software version 6 (SAS Institute Inc., U.S.A.), we aimed to make a predictive equation for determining tablet velocity for all coating machines. The parameters of the prediction equation are pan rotation speed and filling ratio of tablets, and the ranges of these parameters are from 2 rpm to maximum rotation speed of each machine and 25 to 100%, respectively. The equation was expressed as a binary and quadratic function of pan rotation speed and filling ratio as follows:
where,
VT is the tablet velocity,
N is the rotation number (rpm),
F is the filling ratio of tablets and
a1,
a2,
a11,
a22,
a12,
b, α and β are fitting parameters used for the predictive equation. Fitting results of all coating machines are shown in
Table 4 and
Fig. 4. The correlation coefficient of the prediction values calculated from the equation made by JMP and experimental values for all coating machines showed high values of from 0.959 to 0.995, and
p values and root-mean-square error (RMSE) values were small. Therefore, the predictability of the equation is high enough to allow its application for the prediction of tablet velocity using any pan coater. The range of pan rotation speeds and filling ratios used in this study included from the minimum to maximum range of each parameter, therefore, this equation can be applied for all manufacturing parameters of pan coating machines. Moreover, this equation can also be applied for many tablet types because, from the results shown in
Fig. 3, the tablet velocity showed equivalence between two significantly different tablet shapes under the same manufacturing conditions.
Table 4. Fitting Parameters of the Tablet Prediction Equation in Each Coating Machine
| Coater type | DRC-650 | DRC-900 | DRC-1400 | DRC-1600 | HC-170-FZ | HCD-17A | AQC-17AF |
|---|
| b | 0.083 | 0.270 | 0.500 | 0.906 | 0.487 | 0.228 | 0.330 |
| a1 | 0.056 | 0.061 | 0.092 | 0.173 | 0.079 | 0.147 | 0.116 |
| a2 | 0.443 | 0.609 | 0.459 | 0.389 | 0.571 | 0.863 | 1.301 |
| a11 | −0.003 | −0.005 | −0.010 | −0.011 | −0.012 | −0.030 | −0.021 |
| a22 | −0.430 | −1.836 | −1.396 | −3.458 | −0.897 | −1.223 | 5.382 |
| a12 | 0.043 | 0.024 | −0.006 | 0.000 | 0.076 | 0.022 | 0.160 |
| α | −9.750 | 9.000 | 7.111 | −5.625 | 6.000 | −5.071 | 6.000 |
| β | −0.750 | 0.625 | 0.625 | −0.700 | 0.656 | −0.625 | 0.470 |
| R | 0.995 | 0.991 | 0.978 | 0.991 | 0.961 | 0.959 | 0.966 |
In order to evaluate the differences between commercial scale manufacturing conditions and laboratory or pilot scale manufacturing conditions, we predicted the tablet speed of several products in which had occurred some tablet breakage problems during the scale-up study. The comparison results of the tablet speed of each manufacturing scale are shown in Table 5.
Table 5. The Tablet Velocity Prediction Results of Previous Manufactured Products
| Product name | Tablet weight | Tablet shape | Coater type | Filling ratio (feed amount) | Rotation speed | Tablet velocity | Tablet breakage observation |
|---|
| Product A | 654 | Oblong | DRC-1400 | 100% (200 kg) | 2 rpm | 0.70 m/s | No |
| | | HC-170-FZ | 88% (293 kg) | 2.5 rpm | 0.93 m/s | No |
| | | HCD-17 | 63% (303 kg) | 3 rpm | 1.07 m/s | Yes |
| Product B | 100 | Oblong | DRC-650 | 83% (10 kg) | 10 rpm | 1.01 m/s | No |
| | | DRC-900 | 100% (50 kg) | 12 rpm | 1.34 m/s | No |
| | | DRC-1400 | 100% (200 kg) | 7 rpm | 1.41 m/s | No |
| | | HC-170-FZ | 100% (320 kg) | 6 rpm | 1.42 m/s | No |
| Product C | 260 | Oblong | DRC-650 | 100% (12 kg) | 8 rpm | 0.92 m/s | No |
| | | AQC-17AF | 75% (360 kg) | 2 rpm | 0.95 m/s | No |
| Product D | 400 | Round | DRC-900 | 100% (50 kg) | 6 rpm | 0.92 m/s | No |
| | | DRC-1400 | 100% (200 kg) | 7 rpm | 1.41 m/s | No |
| | | AQC-17AF | 100% (500 kg) | 5 rpm | 1.64 m/s | Yes |
The underlined tablet velocity values in Table 5 indicate that the tablets broke during manufacturing under the operating conditions. From these results, it was found that the tablet velocities of broken tablets are higher than the velocities of tablets with no instances of breakage. On the other hand, in the products B and C, which had no breakage under the commercial manufacturing conditions, the tablet speed was equivalent between the commercial scale and laboratory and pilot scales. These results suggest that in the case of tablet breakage, problems occur in the first time of commercial manufacturing, and these problems are caused by the tablet velocity which is higher in the commercial scale than in the laboratory scale. In other words, there is a possibility to avoid the tablet breakage problem in the commercial manufacturing if the tablet velocity is maintained at an equivalent velocity to that in the laboratory scale manufacturing. The predictive method of this study will be useful for setting the pan rotation speed in scale-up studies.
Conclusion
In this study, we measured the tablet velocity in a range of pan coaters under several manufacturing conditions using a high speed camera and PIV software in order to clarify the differences between commercial scale manufacturing and laboratory or pilot scale manufacturing. From the experimental results, we developed a tablet velocity predictive equation using statistical analysis with the pan rotation speed and tablet filling ratio as parameters. By applying this predictive equation, we can understand the differences of the tablet velocities between both scales, and set the tablet speed under commercial manufacturing conditions to be equivalent to the tablet speed found under laboratory scale manufacturing conditions. This predictive equation can be applied regardless of tablet shapes, and it includes the normal operation ranges of pan rotation speeds and tablet filling ratios, and therefore, it can be used for all pharmaceutical drug products (tablets).
Conflict of Interest
The author declares no conflict of interest.
References
- 1) Möltgen C.-V., Puchert T., Menezes J. C., Lochmann D., Reich G., Talanta, 92, 26–37 (2012).
- 2) Corredor C. C., Bu D., Both D., Anal. Chim. Acta, 696, 84–93 (2011).
- 3) Wirges M., Funke A., Serno P., Knop K., Kleinebudde P., J. Pharm. Biomed. Anal., 78–79, 57–64 (2013).
- 4) Gendre C., Genty M., Boiret M., Julien M., Meunier L., Lecoq O., Baron M., Chaminade P., Péan J. M., Eur. J. Pharm. Sci., 43, 244–250 (2011).
- 5) Prpich A., am Ende M. T., Katzschner T., Lubczyk V., Weyhers H., Bernhard G., Comput. Chem. Eng., 34, 1092–1097 (2010).
- 6) Kauffman J. F., Dellibovi M., Cunningham C. R., J. Pharm. Biomed. Anal., 43, 39–48 (2007).
- 7) Markl D., Hannesschläger G., Sacher S., Leitner M., Khinast J. G., Eur. J. Pharm. Sci., 55, 58–67 (2014).
- 8) Mueller R., Kleinebudde P., Eur. J. Pharm. Biopharm., 67, 458–463 (2007).
- 9) Mueller R., Kleinebudde P., Eur. J. Pharm. Biopharm., 64, 388–392 (2006).
- 10) Mueller R., Kleinebudde P., Powder Technol., 173, 51–58 (2007).
- 11) Rowe R. C., Int. J. Pharm., 43, 155–159 (1988).
- 12) Ketterhagen W. R., Int. J. Pharm., 409, 137–149 (2011).
- 13) Pandey P., Song Y., Kayihan F., Turton R., Powder Technol., 161, 79–88 (2006).
- 14) Suzzi D., Toschkoff G., Radl S., Machold D., Fraser S. D., Glasser B. J., Khinast J. G., Chem. Eng. Sci., 69, 107–121 (2012).
- 15) FDA Administration, “Guidance for Industry, SUPAC-IR/MR: Immediate Release and Modified Release Solid Oral Dosage Forms Manufacturing Equipment Addendum,” January, 1999.